FIG. 7.
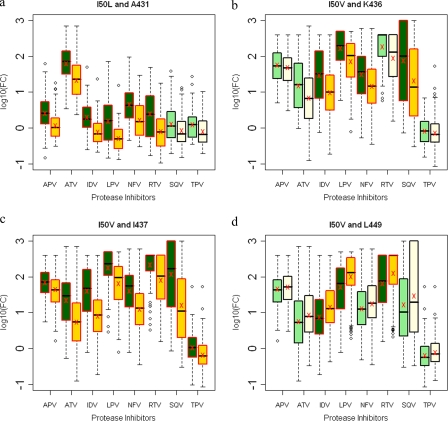
Box plots (ratio of median FCs on a log scale; y axis) showing susceptibilities of I50V and I50L viruses to various PIs (x axis) in the presence (green boxes) or absence (yellow boxes) of associating mutations within the NC-p1 and p1-p6 cleavage sites. The boxes represent the interquartile range between the first and third quartile. The upper and lower lines represent 1.5 times the upper and lower quartile limits. The black line represents the median, and the red X represents the mean of the distribution. Outliers are shown as open circles. Dark green and gold boxes indicate a significant effect of associating mutations within Gag cleavage sites on PI susceptibilities. Shown are susceptibilities of viruses with mutation I50L with and without mutations at Gag 431 (a) and susceptibilities of viruses with mutation I50V with and without mutations at Gag 436 (b), Gag 437 (c), and Gag 449 (d). P values of ≤0.05 are significant.

