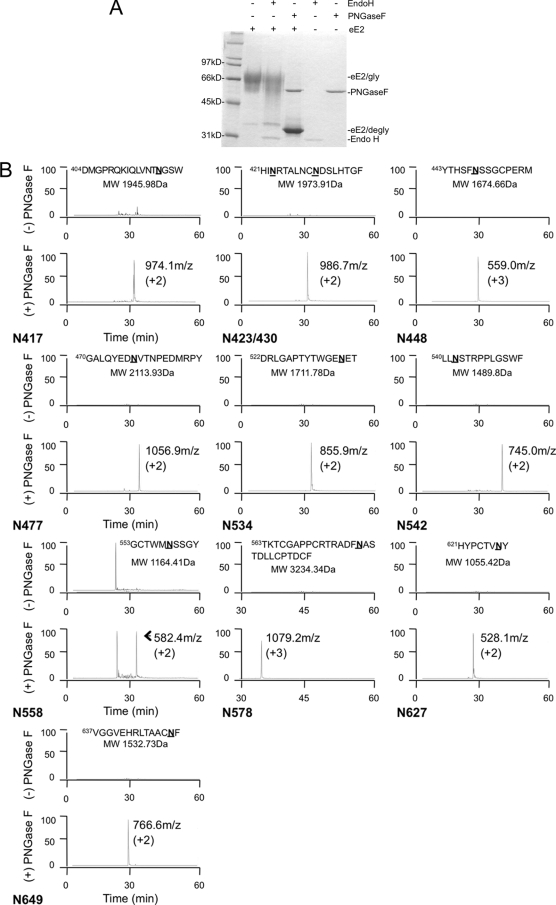
FIG. 2.
(A) Deglycosylation of eE2 with PNGase F and Endo H. Purified eE2 was deglycosylated with PNGase F or Endo H under denaturing and reducing conditions, followed by SDS-PAGE analysis. The positions of the glyscosylated eE2 (eE2/gly), deglycosylated eE2 (eE2/degly), and both enzymes (Endo H and PNGase F) are also shown. (B) Mapping the N-linked glycosylation sites. Each panel contains the extracted ion chromatograms of proteolytic peptides of eE2 with (bottom) or without (top) PNGase F digestion. The data are plotted with the elution time on the x axis, and relative abundance is plotted on the y axis. The peptide sequence and calculated molecular mass used for the extraction are provided at the top of each panel. The measured mass/charge ratio (m/z) and charge state for each spectrum are provided. Note that one panel has a peptide that contains two N-linked glycosylation sites. The identification of each peak was confirmed by MS/MS.

