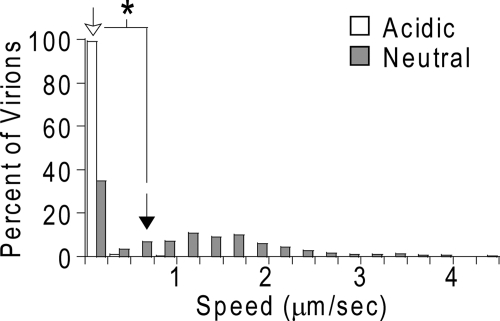
FIG. 2.
Distributions of the average speeds of individual HIV VLPs, as a percentage of the total number of HIV VLPs, in acidic and neutral CVM at a time scale of 1 s. The geometric mean of the distributions is represented by an empty arrow for HIV VLPs in acidic CVM and by a filled arrow for HIV VLPs in neutral CVM. The asterisk represents statistical significance with a one-sided Student t test (P ≤ 0.05).

