FIG. 3.
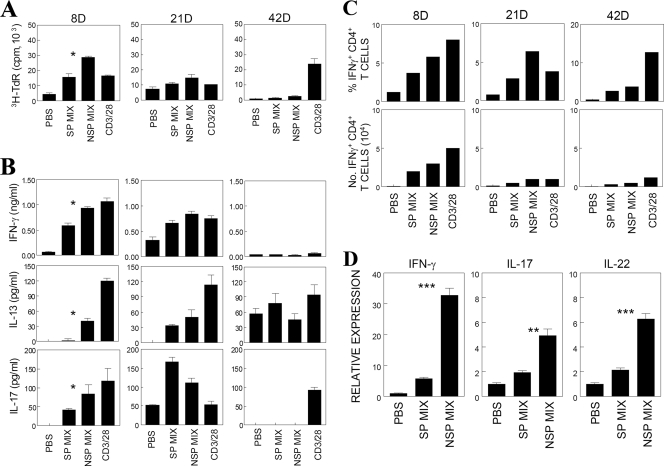
Peripheral and CNS CD4+ T-cell responses during the course of viral infection. (A) Proliferative responses of splenic T cells from mice at 8, 21, and 42 days postinfection (abbreviated as “8D”, etc., in this and subsequent figure panels) after stimulation for 3 days with PBS, capsid peptides (SP mix), noncapsid peptides (NSP mix), or anti-CD3/antiCD28 antibodies. SP mix: 2 μM concentrations of VP1233-250, VP274-86, and VP324-37. NSP mix: 2 μM concentrations of 3D6-23, 3D21-36, and 3D412-430. The results of a triplicate analysis of a single representative experiment out of three separate experiments is shown. (B) Cytokine levels (IFN-γ, IL-13, and IL-17) were measured from the supernatants of splenic cultures that were derived from mice at 8, 21, and 42 days postinfection. Cytokine levels in the supernatants were assessed with ELISA. The values given are the means ± the standard deviations of triplicate wells. (C) Enumeration of IFN-γ-producing CD4+ T cells in the CNS of mice during the course of TMEV infection. IFN-γ-producing cells were examined by flow cytometry after intracellular cytokine staining following stimulation with capsid peptides, noncapsid peptides, or anti-CD3/CD28 antibodies. A representative experimental result out of three similar experiments is shown. (D) Cytokine mRNA expression levels in CNS-infiltrating T cells specific to SP or NSP epitopes of TMEV were analyzed by quantitative PCR. CNS-infiltrating mononuclear cells isolated from TMEV-infected SJL mice at 8 days postinfection were stimulated with a PBS, an SP, or an NSP epitope mix (2 μM for each peptide) for 6 h without additional antigen-presenting cells. The relative cytokine expression is expressed as the fold induction after normalization to GAPDH mRNA. The results in panel D represent triplicate analysis of a single representative experiment. Similar patterns of cytokine gene expression were observed from two additional experiments.

