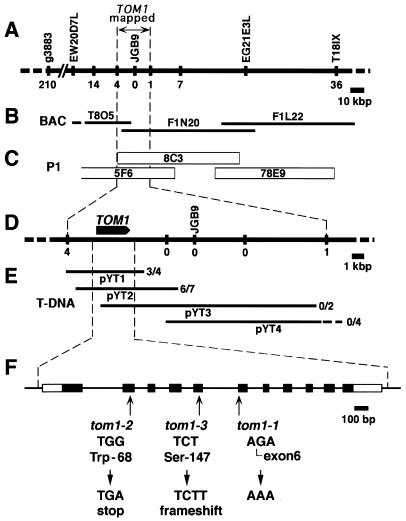
Figure 1.
Genetic mapping and positional cloning of TOM1. (A) Genetic map around the TOM1 locus on chromosome 4. Vertical bars represent DNA markers. Each number represents recombination events between the marker and the TOM1 locus among 3,103 F2 plants. (B and C) Contigs of ESSA II bacterial artificial chromosome clones and Mitsui P1 clones encompassing the TOM1 locus, respectively. (D) Fine map around the TOM1 locus. Vertical bars and numbers are the same as in A. The position and orientation of the TOM1 gene is shown by the arrow. (E) T-DNA contigs. T-DNA clones derived from the P1 clones 8C3 or 5F6 were organized into an overlapping set that spanned the TOM1 locus. These T-DNA clones were used to genetically transform tom1–1 mutant plants, which subsequently were tested for complementation of the TMV-Cg multiplication phenotype. The ratio of numbers of transformed lines that showed wild-type level TMV-Cg multiplication vs. total lines tested for TMV-Cg multiplication is indicated at the right of each T-DNA clone. (F) Intron-exon organization of the TOM1 gene and the tom1 mutations. Exons are indicated by boxes. Open boxes indicate noncoding regions, and filled boxes indicate coding regions. Mutations in the three tom1 alleles are shown below the intron/exon structure.

