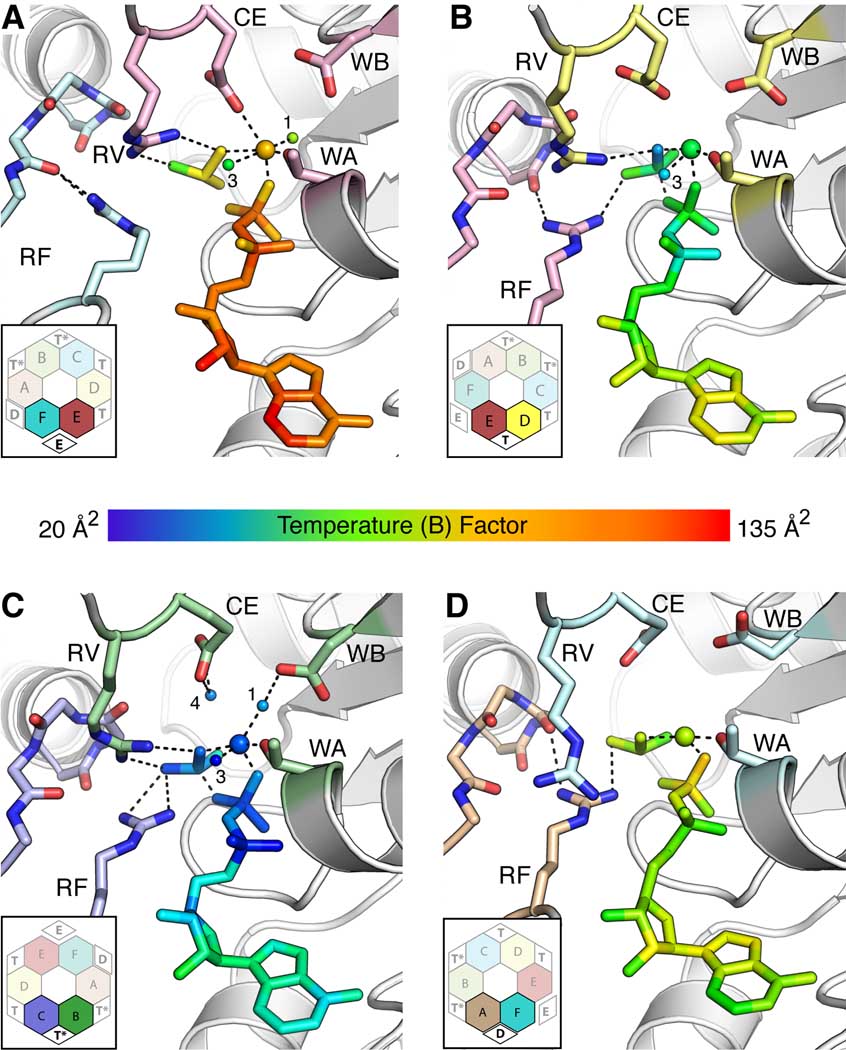
Figure 3. Structural asymmetry generates four ATP binding states.
Views of (A) Exchange - E; (B) ATP - T; (C) ATP hydrolysis - T*; (D) ADP - D active sites. Each inset shows the interface location (bold and black text) with respect to the rest of the hexamer (faded and grey text). For nucleotide and associated Mg2+/water molecules, coloring is by B-factor, with blue indicating low values (20–35 Å2) and red high values (120–135 Å2). By contrast, selected catalytic motifs are shown in stick representation and colored by subunit in accordance with Figure 1A. ADP and BeF3 are shown as sticks. Bound Mg2+ and associated water molecules are shown as large and small spheres, respectively; the water molecules are numbered according to their position in the active site. Bonding interactions are shown as dashed lines. Abbreviations: WA – Walker A, WB – Walker B, CE – Catalytic Glutamate, RV – Arginine Valve, RF – Arginine Finger.

