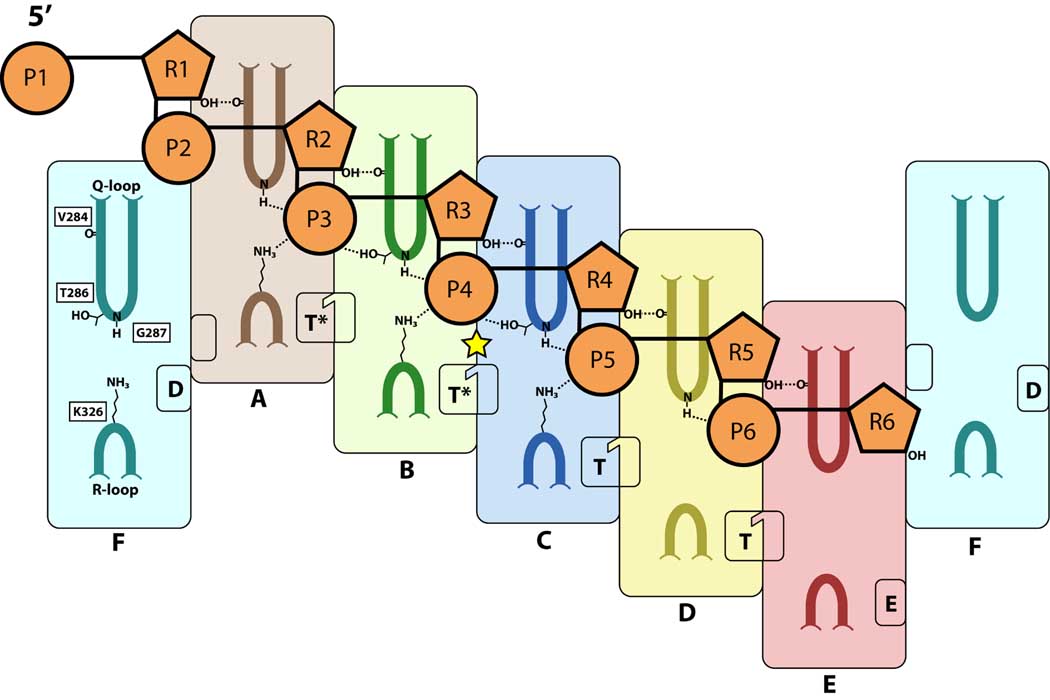
Figure 4. Correlation between ATP and RNA binding.
Schematized view of RNA-binding contacts and ATP-binding states. Protein subunits are illustrated as large, rounded rectangles and colored as per Figure 1A. Q and R loops are drawn with darker, colored lines to highlight their positions. The perspective is similar to Figure 1B, except that the subunits are pulled open and spread flat on the page. Subunit F is shown twice to highlight its orientation with respect to subunits A and E. The two halves of the bipartite ATP-binding site are illustrated as small rounded rectangles; linked, notched rectangles represent insertion of the arginine finger into the active site of T and T* states. Ribose (R) and phosphate (P) moieties of the RNA backbone are colored orange and numbered according to the structure. Protein residues contacting RNA are labeled, and chemical groups that bond with the RNA are shown (dashed lines). The yellow star indicates the B/C interface in which adjacent subunits have maximized their protein-RNA contacts.

