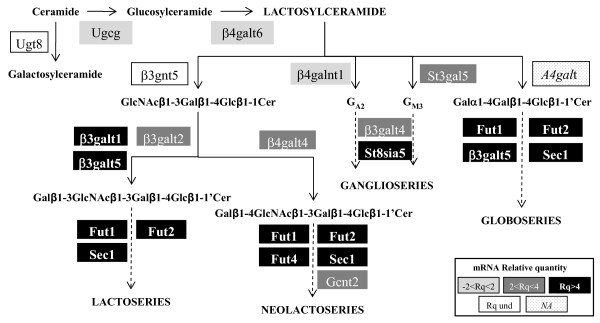
Figure 4.
Schematic representation of glycosphingolipid synthesis pathways. The enzymes responsible for the main steps of glycosphingolipid biosynthesis are indicated. The expression levels (relative quantity of mRNA) of the corresponding genes are reported. NA: Not Analyzed; Rq: Relative quantity; Und: Undetermined.

