
Figure 2.
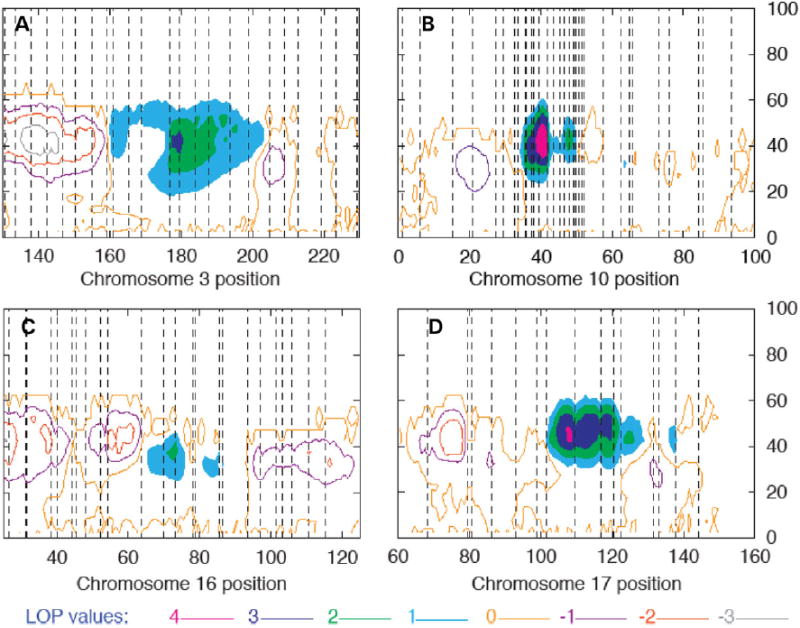
Details of LOP contour plots from Figure 2. One unit LOP contours are shown for a 100 cM region about the linkage peak. The highest contour level (seen on chromosomes 10 and 17) is >4. Regions between LOP contours >1 are shaded. The X-axis indicates the position along the chromosome in Haldane cM. The Y axis indicates the mean effect size of the QTL localized. The vertical lines indicate marker positions on each chromosome as follows: (A) Chromosome 3: D3S1278, D3S1558, D3S1267, D3S3606, D3S1292, D3S3637, D3S1309, D3S1569, D3S1593, D3S1555, D3S1279, D3S3668, D3S1614, D3S3725, D3S1565, D3S3715, D3S3609, D3S1262, D3S3686, D3S1580, D3S1601, D3S2748, D3S1265; (B) Chromosome 10: D10S249, D10S1745, D10S591, D10S189, D10S1649, D10S547, D10S2325, D10S570, D10S1725, D10S223, D10S1664, D10S191, D10S1653, D10S674, D10S504, D10S548, D10S203, D10S211, D10S550, D10S1749, D10S586, D10S572, D10S197, D10S213, D10S208, D10S1780, D10S578, D10S196, D10S1790, D10S1652, D10S581, D10S537; (C): Chromosome 16: D16S404, D16S3075, D16S3102, D16S500, D16S3103, D16S3041, D16S3046, D16S403, D16S3068, D16S3100, D16S3136, D16S3034, D16S415, D16S3057, D16S3140, D16S514, D16S503, D16S3066, D16S515, D16S3049, D16S516, D16S3040, D16S505, D16S3091 and (D): Chromosome 17: D17S927, D17S1868, D17S1795, D17S787, D17S957, D17S944, D17S1816, D17S949, D17S1862, D17S1807, D17S785, D17S1847, D17S836, D17S784, D17S928.