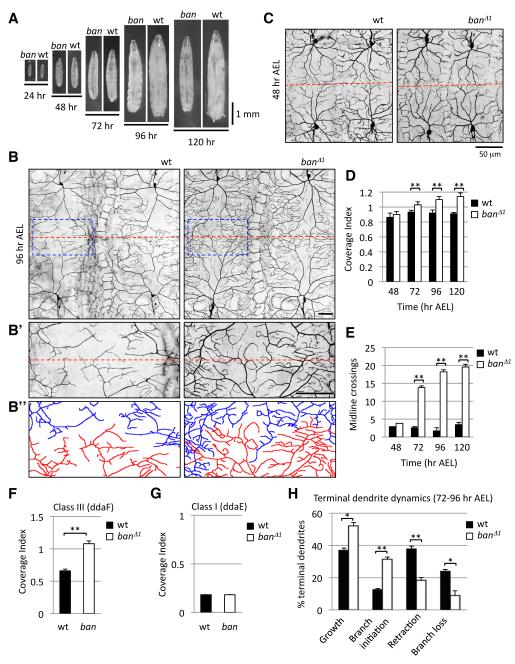
Figure 3.
ban is required for scaling growth of dendrites in a subset of da neurons.
(A) Growth profile of control and ban mutant larvae.
(B) Dendrite morphology of wt and ban mutant larvae at 96 hr AEL visualized with ppk-EGFP. The interface of two ddaC neurons at the dorsal midline is shown in (B’) and dendrites are depicted as camera lucida to help distinguish dendrites of adjacent neurons in (B”). Scale bars are 50 μm.
(C) Dendrite morphology of wt and ban mutant larvae at 48 hr AEL visualized with ppk-EGFP.
(D-E) Time course monitoring the dendrite coverage index (D) and midline crossing (E) of ddaC dendrites in wt or ban mutant larvae. n > 5 for all time points.
(F-G) Coverage index for (F) ddaF class III neurons and (G) ddaE class I neurons at 96 hr AEL. n = 10.
(H) Quantification of terminal dendrite dynamics measured over a 24 hr time lapse (72-96 hr AEL) in wt and ban mutant larvae. n > 1000 terminal dendrites (from 10 neurons) for each genotype.
Here and in subsequent figures, error bars represent SEM, * denotes p < 0.05 and ** denotes p < 0.001.

