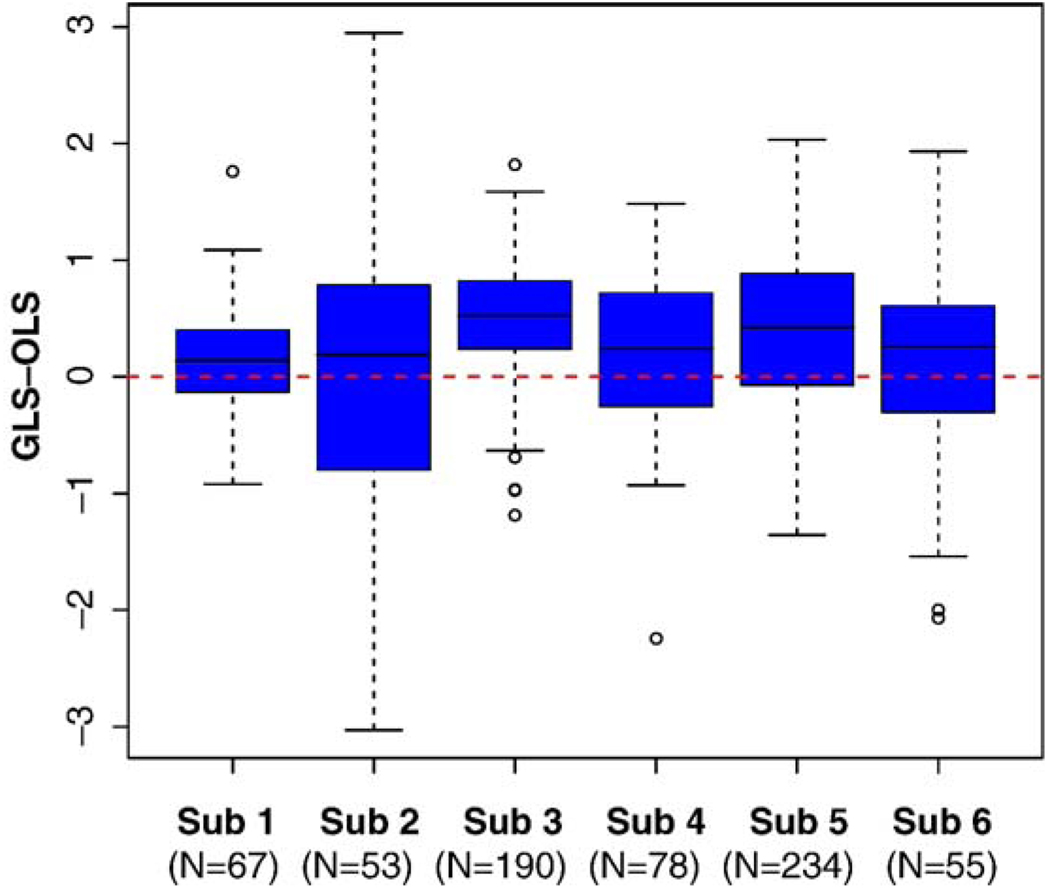
Figure 11.
Boxplots of difference in Z values when the Z value from either method was larger than 2. The number of voxels included in each subject’s boxplot are indicated beneath the subject number. Boxplots display the distribution of data by showing the median (horizontal black line in box), the first and third quartiles of the data (edges of the blue box), range of points included within 1.5* interquartile range (whiskers) and outliers (points). Positive values indicate greater sensitivity with full data using GLS.

