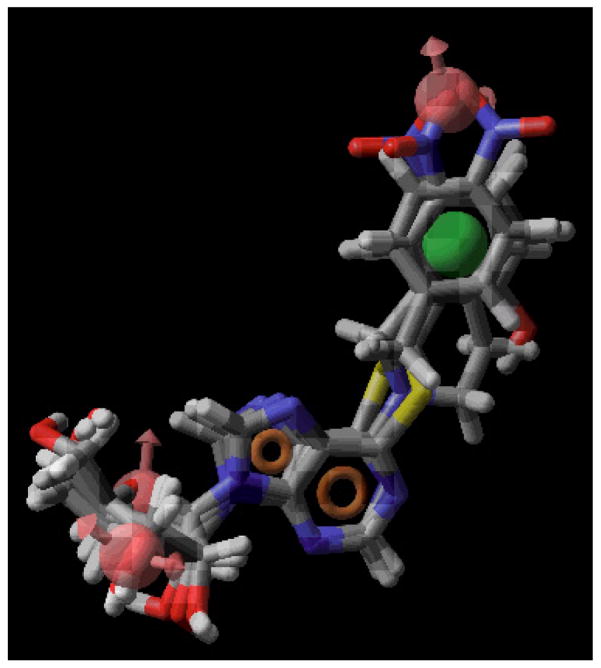
Figure 5.
The best-generated pharmacophore model (Pharm_A) obtained from PHASE. Pharmacophore features are red vectors for hydrogen bond acceptors (A), orange rings for aromatic groups (R), and green balls for hydrophobic functions (H). NBMPR, compound 4, and compound 25 were aligned to the pharmacophore. For the molecules, blue indicates nitrogen, red indicates oxygen, yellow refers to sulfur, gray indicates carbon, and white indicates hydrogen.

