Fig.2.
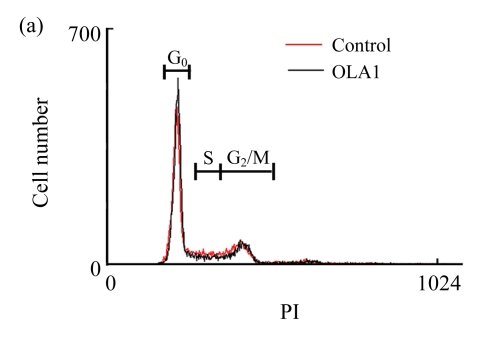
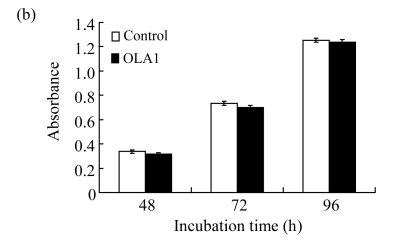
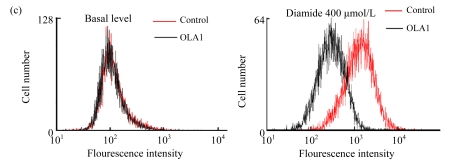
Knockdown of OLA1 has no effect on cell growth but inhibits ROS production
(a) Cell cycle analysis: 48 h after transfection with the control siRNA or the OLA1 siRNA, the cells were stained with PI and analyzed by flow cytometry. Histograms shown are representative from 3 independent experiments. Phases of the cell cycle are indicated above the histograms; (b) Cell growth rate as monitored by MTS assay following the siRNA transfection. At the indicted time periods post-transfection, cells were incubated with MTS for 2 h, and measured for absorbance at 540 nm. Data are represented as mean±SD from 3 independent experiments; (c) Knockdown of OLA1 attenuated the production of ROS. Unchallenged cells (baseline) and cells treated with 400 μmol/L of diamide for 1 h were subjected to carboxy-H2DCFDA labeling and flow cytometry analysis. Histograms shown are representative from 3 independent experiments


