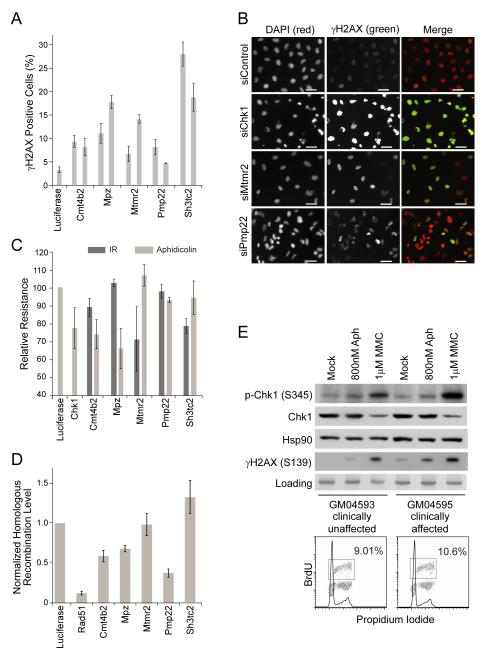
Figure 6. Loss of Charcot-Marie-Tooth disease genes leads to increased DNA damage and repair defects.
(A) Percentage of γH2AX+ cells after knockdown of the indicated genes. Duplicate bars indicate effects of individual siRNAs tested. (B) Images of γH2AX signal 72h after knockdown of the indicated gene. Scale bar indicates 50μm. (C) Sensitivity to aphidicolin (100nM) or IR treatment (2Gy). Samples were corrected for the effect of the indicated siRNA on growth rate and then normalized to the siLuciferase-transfected sample. Details can be found in the supplemental methods. (D) HR repair frequency at an induced double-strand break after knockdown of the indicated gene. Samples were normalized to the HR frequency in the siLuciferase-transfected cells. (E) p-Chk1 and γH2AX response in GJB1 patient cell lines. Samples were collected 24 hrs after drug addition. BrdU plots indicate there is no significant difference in the cell cycle distribution of the mock treated cells. All graphs shown are mean ± SE for n=3.

