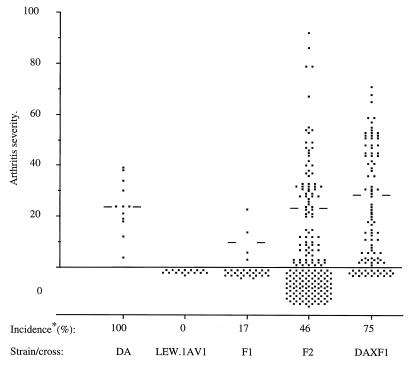
Figure 1.
Arthritis scores for the parental rat strains and F1 and F2 progeny: DA (no. 12), LEW.1AV1 (no. 16), (DA × LEW.1AV1)F1 (no. 29), (DA × F1)Bx (no. 96), and (DA × LEW.1AV1)F2 (no. 189). Bars indicate the median arthritis score of the affected animals in each group. The incidence is calculated as the percent of animals with arthritis scores between 1 and 92 (the animals affected with arthritis).

