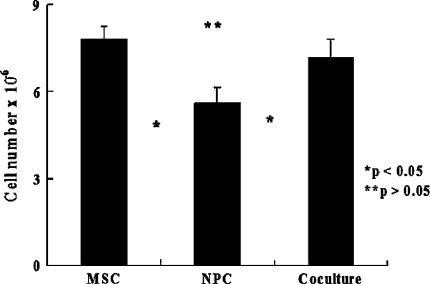
Fig. 2.
A graph shows the results of the cell growth assay after coculture for 14 days. The number of cells increased gradually in all the cultured cell groups. The cell growth rate was greater in NPCs cocultured with MSCs than in NPCs cultured alone (MSCs versus NPCs, p = 1.14 × 10⁻⁵; MSCs versus cocultured cells, p = 0.24; NPCs versus cocultured cells, p = 3.2 × 10⁻⁴; n = 6).

