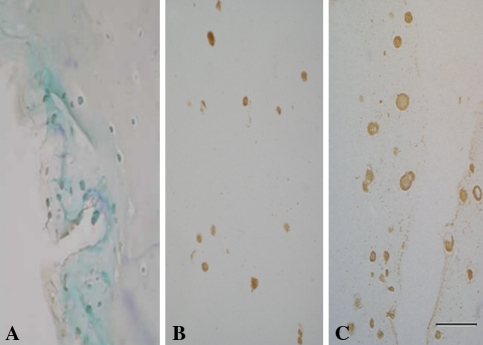
Fig. 6A–C.
The photomicrographs illustrate the results of immunohistochemical analysis for KS. When compared with (A) MSCs, immunohistochemical analysis revealed strong staining for KS (brown) in (B) NPCs and (C) cocultured cells (Stain, immunostain; original magnification, ×200; size bar, 1 unit = 50 μm).

