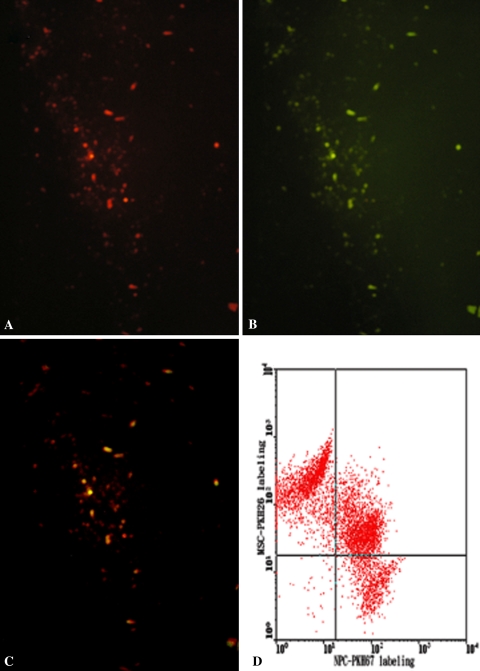
Fig. 8A–D.
The photomicrographs illustrate in situ cell labeling with PKH to trace cell fusion. (A) PKH26-stained cells (red) and (B) PKH67-stained cells (green) were observed. (C) Some cocultured cells expressed both PKH dyes and were detected at the same position on the slide, with the same focus (yellow) (Original magnification, ×200). (D) A scatterplot shows the detection of PKH-stained cells by cell sorting. FACS analysis revealed approximately 42% of the cocultured cells took up both stains.

