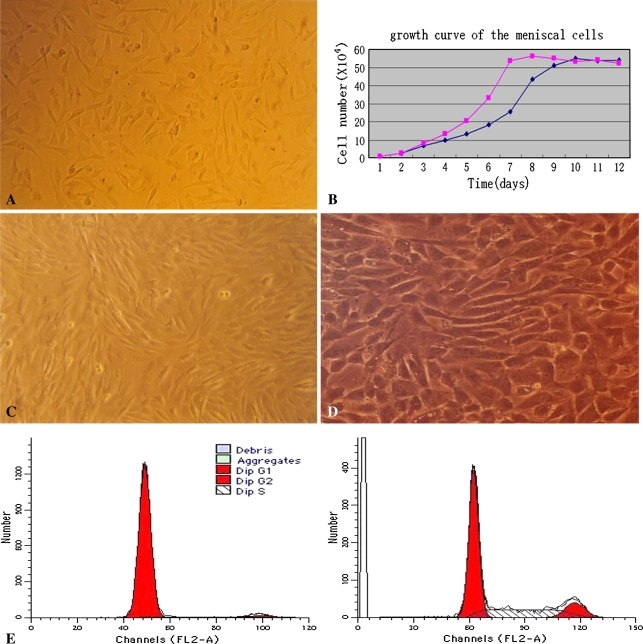
Fig. 4A–E.
The proliferation and morphology of the cells changed after transfection. (A) Before gene intervention, the cells had varying cell morphologies (no stain; original magnification, ×40). (B) After transfection the growth curve of the cells migrated left, (C) the proliferation was accelerated with multiple cell aggregations (no stain; original magnification, ×40), and (D) the cells enlarged and appeared as slabstones after introduction of the hIGF-1 gene (no stain; original magnification, ×40). (E) Flow cytometry analysis demonstrated upregulation of cell number in G2 and S stages after hIGF-1 gene introduction.

