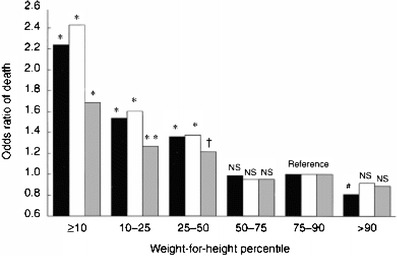
Fig. 2.

Odds ratio of death among 12,965 adult patients grouped by weight-for-height percentiles. Three representations are given in a cluster of three bars. Black bars represent unadjusted odds ratio, white bars represent odds ratio adjusted for clinical variables (age, gender, race and diabetes mellitus), gray bars, adjusted for clinical and laboratory variables (pre-dialysis serum albumin, creatinine and cholesterol values). NS not significant. Reprinted with permission from Macmillan Publishers Ltd., Kidney Int 56:1136–1148 [15]. The P values symbols over a bar indicate the significant difference between the values for that bar and for the reference group. *P<0.001, **P=0.11, †P=0.21, #P=0.038
