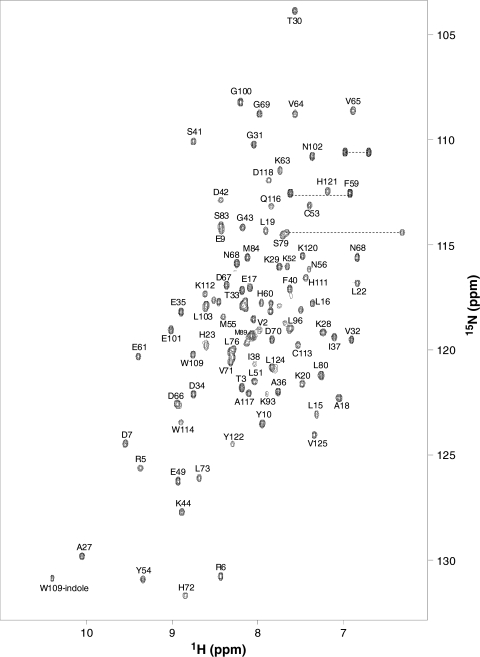
Fig. 1.
Two-dimensional 15N–1H HSQC spectrum of Cqui-OBP1 bound to MOP at pH 7.0 recorded at 600-MHz 1H frequency. Side-chain amide peaks are connected by the dotted lines. The protein sample was uniformly labeled with nitrogen-15. Resonance assignments are indicated and are reported in BMRB accession no. 16175

