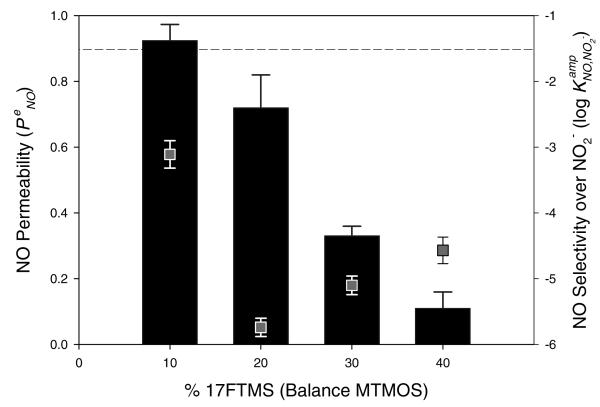
Figure 6.
NO permeability (bar graphs, left axis) and selectivity over nitrite (scatter plots, right axis) as a function of the concentration of 17FTMS (balance MTMOS). All xerogels were synthesized under acid-catalyzed conditions. The dashed line indicates NO selectivity for the bare Pt electrode over nitrite. Data are represented as means ± SD (n is at least 3).

