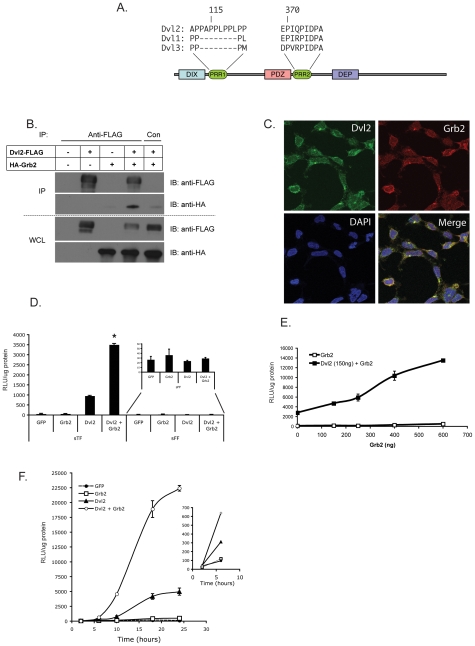
Figure 1. Dvl2 contains putative SH3-binding domains.
(A) Schematic representation of Dvl1, 2 and 3 showing the proline –rich, putative SH3-binding domains (Proline Rich Regions, or PRR). PRR2 was identified previously in drosophila Dsh as a domain critical for its function. (B) Dvl2 and Grb2 co-immunoprecipitate. FLAG-tagged Dvl2 and HA-tagged Grb2 were expressed individually or together in HEK293 cells. 24 hrs later, the cells (∼5–6×10⁶) were harvested and lysed for 15 min in RIPA buffer containing protease and phosphatase inhibitors. Lysates were cleared, and Dvl2 immunoprecipitated overnight at 4°C with anti-FLAG antibodies. Immune complexes were captured with protein-G coated sepharose beads for 2 hrs at RT. An isotype control antibody was used in parallel. Strips were cut from the same blot and were probed with anti-FLAG or anti-HA antibodies. Whole cell lysate (WCL) was used as a control. (C) Dvl2 and Grb2 co-localize in cells. Confocal microscopy demonstrates punctate distribution of both proteins with considerable cytoplasmic co-localization. Dvl2 is also found in the nucleus. Isotype control staining was negative. (D) Dvl2 and Grb2 synergize to drive LEF/TCF-dependent transcription. HEK293 cells were co-transfected with sTOPflash or the negative control sFOPflash along with GFP, Dvl2, Grb2 or Dvl2 and Grb2 together. Cells were harvested 24 hrs later for luciferase analysis. * – effect of Dvl2 + Grb2 differs significantly from effect of either alone: p<0.01. (E) Dose dependent synergy of Grb2 with Dvl2. HEK293 cells were transfected with sTF as in (D) along with Dvl2 and increasing doses of Grb2. Cells were harvested 24 hrs later. p<0.01 at all time points. (F) The onset of synergy is rapid. HEK293 cells were transfected with GFP, Dvl2, Grb2, or Dvl2 and Grb2 together. Three hrs post recovery was set as t = 0 as this was the earliest GFP could be detected above background. Cells were then harvested at: t = 2,6,10,18 and 24 hrs. Synergy between Dvl2 and Grb2 is achieved as early as 6 hrs (see inset). For all time points 6 hrs and beyond, p<0.01. All luciferase data are normalized to total protein content. Mean and standard error of the mean are shown – where absent, the SEM falls within the symbol. Significance assessed by Student's t-test.

