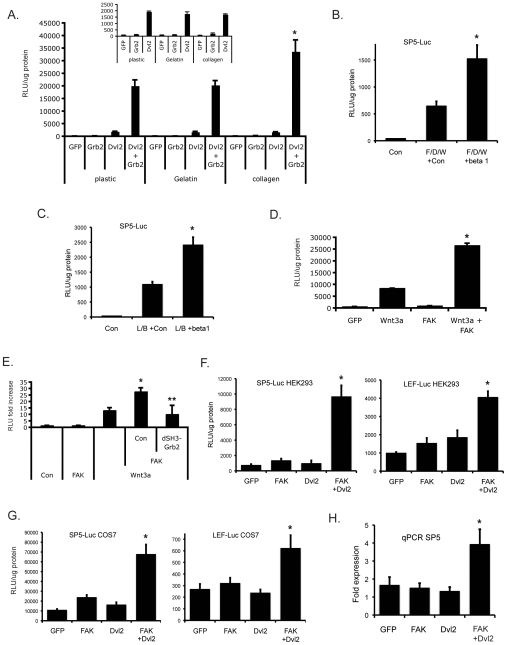
Figure 6. Matrix/Focal Adhesion Kinase-derived signals synergize with the wnt pathway.
(A) Dvl2-Grb2 signaling is amplified on collagen. HEK293 cells were transfected with sTF reporter, Dvl2 and Grb2 plasmids as indicated and cultured on plastic, gelatin or collagen for 24 hrs before harvest for luciferase assay. * – p<0.01, relative to Dvl2 + Grb2 on plastic or gelatin. Inset – Dvl2-driven sTF (in the absence of Grb2) is not sensitive to substrate. Mean and SEM shown. (B) β1 integrin synergizes with wnt signaling. Cells were transfected with SP5-Luc, along with FAK, Dvl2 and Wnt3a expression plasmids (F/D/W) and GFP (Con) or β1-integrin-Tac expression plasmids. Cells were harvested at 24 hrs for luciferase assay. * – p<0.01, relative to F/D/W + Con. (C) As for (B) except wnt signaling was driven by LEF1 and β-catenin (L/B). * – p<0.01, relative to L/B + Con. (D) FAK synergizes with Wnt3a signals. Cells were transfected with sTF, along with Wnt3a and FAK expression plasmids and harvested at 24 hrs for luciferase assay. * – p<0.01, relative to Wnt3a or FAK alone. (E) Grb2 is downstream of FAK. Cells were transfected with sTF, along with Wnt3a, FAK and dSH3-Grb2 expression plasmids as indicated, and harvested at 24 hrs for luciferase assay. * – p<0.01, relative to Wnt3a or FAK alone. ** – p<0.05, relative to Wnt3a + FAK + Con (GFP). (F) FAK and Dvl2 synergize to drive multiple wnt target promoters in HEK293 cells. Cells were transfected with SP5-Luc or LEF-Luc, along with FAK and Dvl2 either together or alone, and harvested at 24 hrs for luciferase assay. * – p<0.01 relative to FAK or Dvl2 alone. (G) FAK and Dvl2 synergize to drive multiple wnt target promoters in COS7 cells. Cells were transfected with SP5-Luc or LEF-Luc, along with FAK and Dvl2 either together or alone, and harvested at 24 hrs for luciferase assay. * – p<0.01 (SP5) or p<0.02 (LEF) relative to FAK or Dvl2 alone. (H) FAK and Dvl2 synergize to induce endogenous SP5 mRNA expression. HEK293 cells were transfected as in (F) and harvested for qRT-PCR of SP5 expression at 24 hours. Fold expression (mean and SEM) relative to GAPDH is shown. * – p<0.025 relative to FAK or Dvl2 alone. All luciferase data are normalized to total protein content and mean and standard deviation are shown unless indicated otherwise. Significance assessed by Student's t-test.

