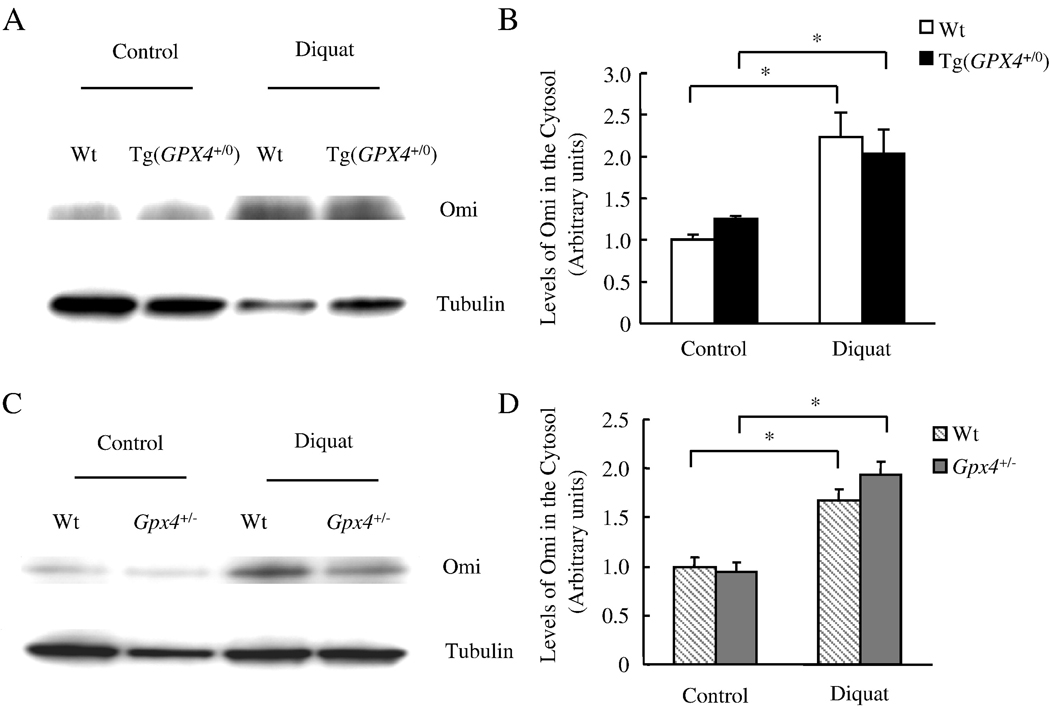
Figure 5. Effect of Gpx4 on diquat-induced Omi/HtrA2 release from liver mitochondria.
Tg(GPX4+/0) and Gpx4+/− mice and their corresponding Wt littermates were either untreated or treated with diquat. Omi/HtrA2 release was determined by measuring the levels of Omi/HtrA2 in the cytosol using Western blotting as described in the Experimental Procedures. Panel A: Photograph of a representative Western blot showing Omi/HtrA2 release into the cytosol from the Tg(GPX4+/0) mice and their Wt littermates. Panel B: Quantification of Omi/HtrA2 release in the Tg(GPX4+/0) mice (solid bars) and their Wt littermates (open bars) as determined from the Western blotting. Panel C: Photograph of a representative Western blotting showing Omi/HtrA2 release into the cytosol from the Gpx4+/− mice and their Wt littermates. Panel D: Quantification of Omi/HtrA2 release in the Gpx4+/− mice (shaded bars) and their Wt littermates (hatched bars) as determined from the Western blotting. All values are mean ± SEM of data obtained from 3–4 mice. The asterisks indicate the differences that are significantly different.

