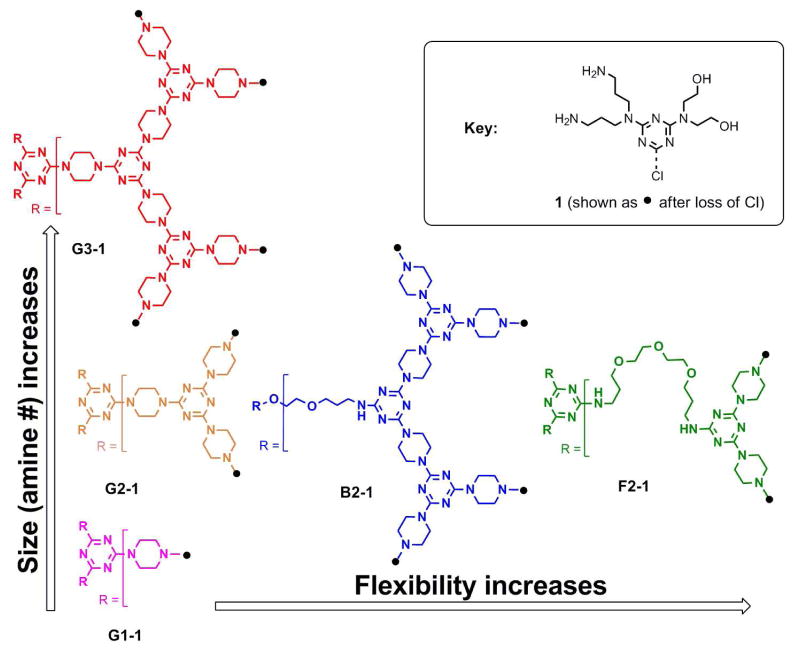
Figure 1.
The dendrimer panel is given as chemical structures and sketches in a color code used throughout the study. Structure activity relationships of the dendrimers in Table 1 were investigated in a two-dimensional approach: By variation of the generation (vertical arrows) and the core structure (horizontal arrows), influence of both parameters were investigated. 123×101mm (300 × 300 DPI)

