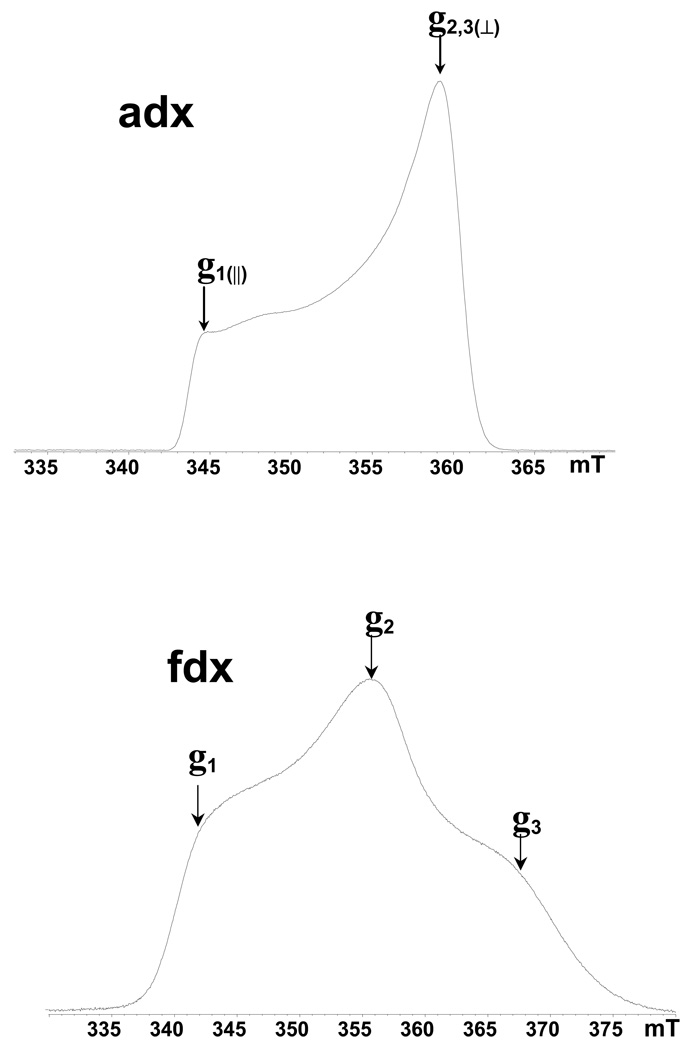
Figure 1.
Two-pulse field-sweep ESE spectra of the reduced Rieske-type cluster in adx and fdx recorded with τ = 200 ns. Arrows show the positions where orientation-selected ESEEM and HYSCORE spectra were measured. The microwave frequency of the pulsed EPR spectrometer was ∼9.7 GHz. Slight variation of the ESE amplitude is seen in the weak slope of the adx spectrum in the low-field region. Similar changes in regions of the spectrum with steeper slopes would not be so visible. It is likely to be produced by the dependence of the ESEEM depth on the field and/or orientation.

