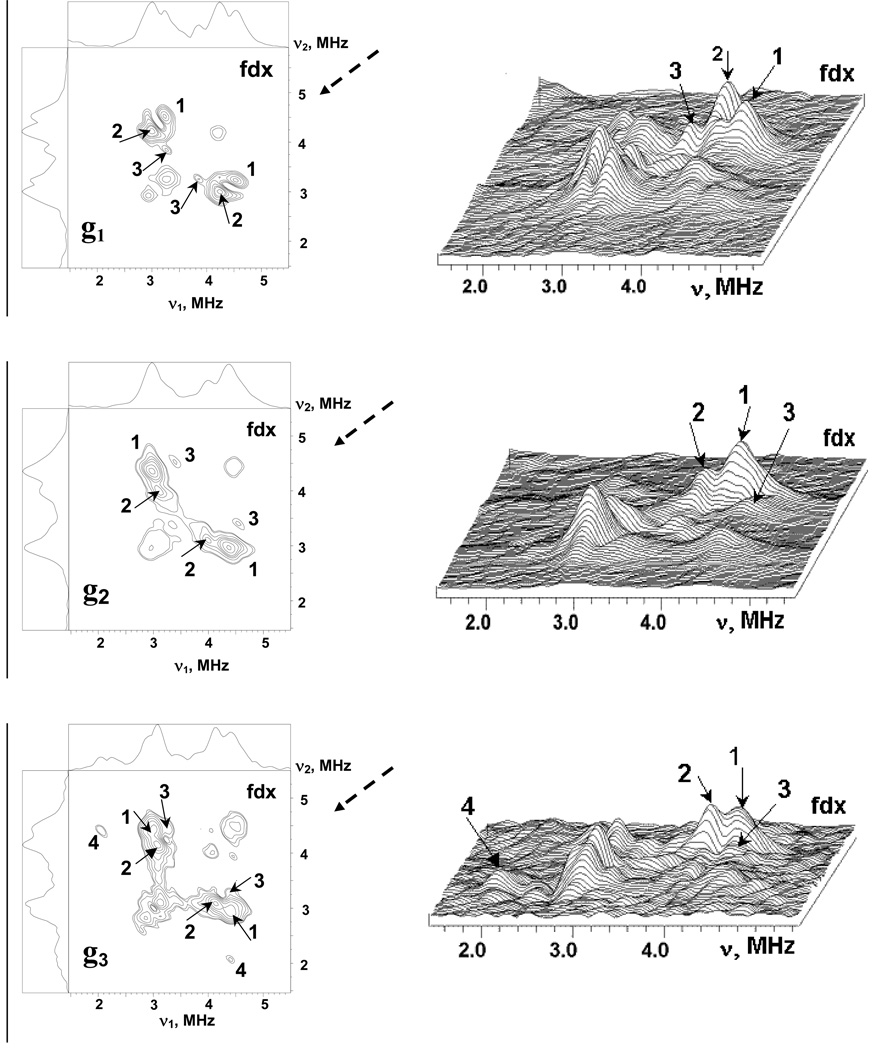
Figure 5.
The contour (left) and stacked (right) presentations of 14N HYSCORE spectra of the reduced [2Fe-2S] cluster in the fdx. Spectra measured near g1=2.052, g2= 1.957, g3=1.887 at the fields 341.8, 356.2 and 370.0 mT, respectively. The time τ between first and second microwave pulses is equal to 136 ns for all spectra. Arrows indicate the direction from which the 3D stacked perspective is viewed.

