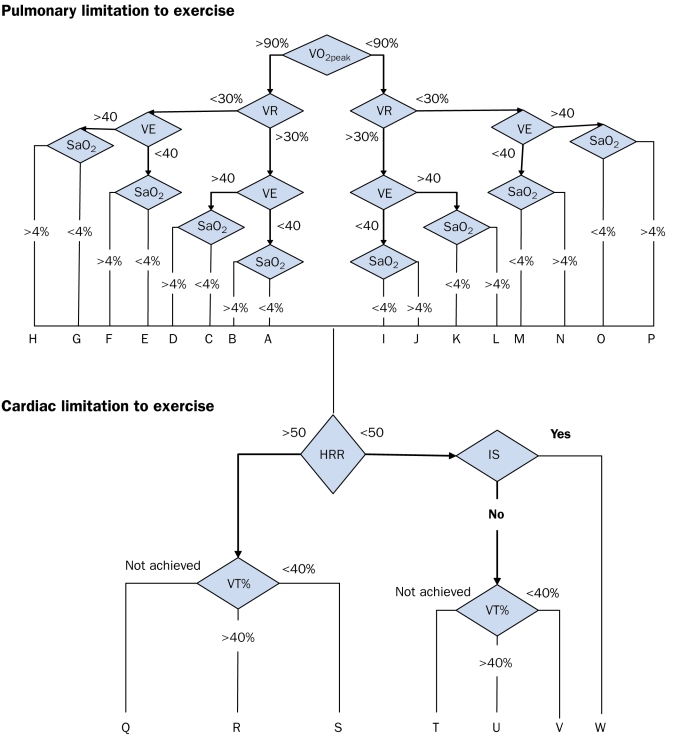
Figure 1.
Algorithm for interpretation of CPET data in adults. For an explanation of the interpretation see tables 3 and 4. Modified from Eschenbacher and Mannina.45 VE=Ventilator equivalent for carbon dioxide; SaO2=change in arterial saturation; IS=Ischemic Symptoms; HRR=Heart Rate Response; VT%=Ratio of VT to predicted VO2peak.

