
Fig. 4.
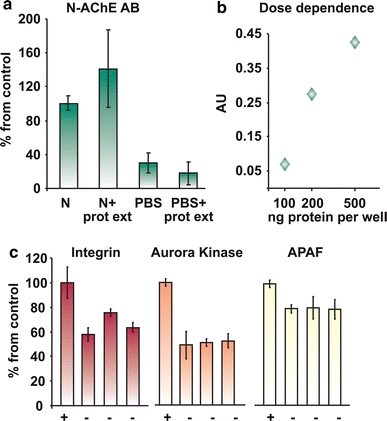
Peptide array for protein interactions: a Positive control. Note the first two bars detection compared to the negative controls. b Dose dependence. Different concentrations of the synthetic peptide were added to the plate, and detected by the N-specific antibody, showing the sensitivity of the assay. c Positive interaction