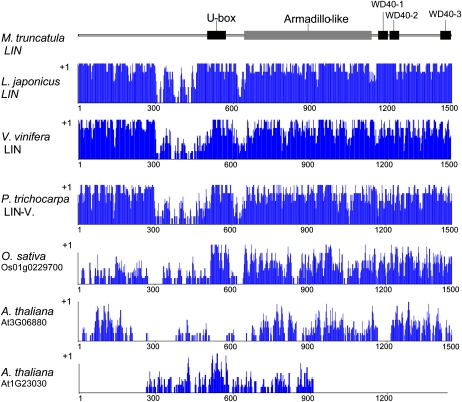
Figure 5.
Schematic presentation of the domain structure of the M. truncatula LIN protein and similarity levels with closely related plant proteins. Predicted domains of the M. truncatula LIN protein are indicated in the schematic drawing at the top. Below the domain structure is a graphical representation of the alignment of the M. truncatula LIN protein with the best plant homologs plotted by the AlignX program of VectorNTI (Invitrogen) as follows: specific values (in a 0–1 range) are assigned to each residue at a given alignment position in each aligned sequence, depending on whether the residue is identical, similar, or weakly similar to the corresponding residue of the consensus sequence. [See online article for color version of this figure.]

