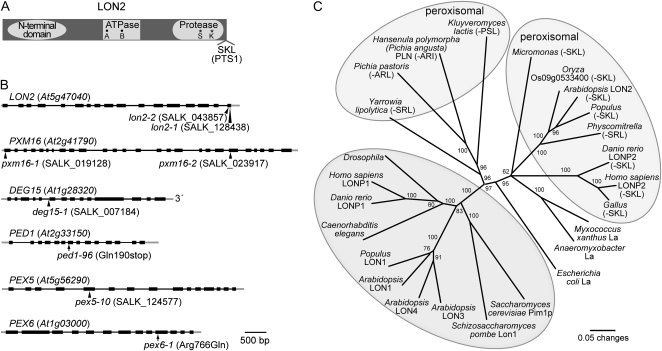
Figure 1.
Diagram of LON2 protein domains, gene models for LON2, PXM16, DEG15, PED1, PEX5, and PEX6, and phylogenetic relationships of LON family members. A, Organization of the 888-amino acid LON2 protein. Locations of the N-terminal domain conserved among Lon proteins, predicted ATP-binding Walker A and B domains (black circles), active site Ser (S) and Lys (K) residues (asterisks), and the C-terminal Ser-Lys-Leu (SKL) peroxisomal targeting signal (PTS1) are shown (Lee and Suzuki, 2008). B, Gene models for LON2, PXM16, DEG15, PED1, PEX5, and PEX6 and locations of T-DNA insertions (triangles) or missense alleles (arrows) used in this study. Exons are depicted by black boxes, introns by black lines, and untranslated regions by gray lines. C, Phylogenetic relationships among LON homologs. Sequences were aligned using MegAlign (DNAStar) and the ClustalW method. The PAUP 4.0b10 program (Swofford, 2001) was used to generate an unrooted phylogram from a trimmed alignment corresponding to Arabidopsis LON2 residues 400 to 888 (from the beginning of the ATPase domain to the end of the protein). The bootstrap method was performed for 500 replicates with distance as the optimality criterion. Bootstrap values are indicated at the nodes. Predicted peroxisomal proteins have C-terminal PTS1 signals in parentheses and are in light-gray ovals. Proteins in the darker gray oval have N-terminal extensions and include mitochondrial and chloroplastic proteins. Sequence identifiers are listed in Supplemental Table S2.

