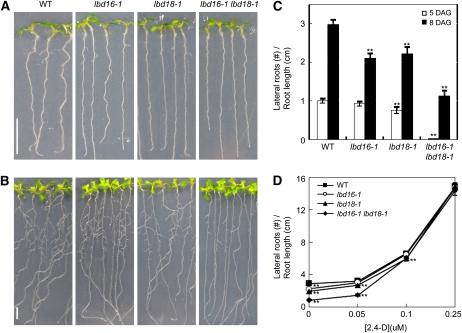
Figure 2.
Lateral root phenotypes of lbd16, lbd18, and lbd16 lbd18 mutants. A and B, Lateral roots of T-DNA insertion mutants and the wild type (WT). Photographs were taken 5 d (A) or 8 d (B) after germination. Bars = 1 cm. C, Number of lateral roots at different days after germination (DAG). The white columns and black columns indicate the lateral root numbers of plants grown vertically 5 and 8 d after germination, respectively. n > 29. Lateral roots were counted with a dissecting microscope. Lateral root numbers per unit root length (cm) measured were plotted. D, Number of lateral roots with varying concentrations of 2,4-D. Lateral root numbers of 5-d-old seedlings grown vertically were counted 4 d after transfer to medium containing the indicated concentrations of 2,4-D. n > 18. Lateral root numbers per unit root length (cm) measured were plotted. Asterisks denote statistical significance at P < 0.01.

