Figure 2.
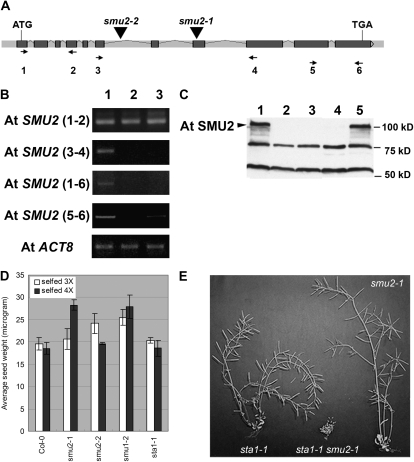
A, Structure of the AtSMU2 gene. Dark gray boxes and light gray bars between the boxes represent exons and introns, respectively. Triangles indicate T-DNA insertion sites in the Atsmu2-1 and Atsmu2-2 mutants. B, RT-PCR analysis of AtSMU2 transcripts. Four pairs of primers were used for amplifying different regions of the AtSMU2 mRNA sequence prepared from wild-type 14-DAG Col-0 (lane 1), smu2-1 (lane 2), and smu2-2 (lane 3) seedlings. Numbers in parentheses indicate the primers used for RT-PCR, and their positions are shown as arrows in A. AtACT8 transcript encoding an actin was used as an internal control. C, Immunoblot analysis of AtSMU2 using protein extracts from four 7-DAG Col-0 (lane 1), smu2-1 (lane 2), smu2-2 (lane 3), smu1-2 (lane 4), and sta1-1 (lane 5) seedlings as described by Chung et al. (2007). The arrowhead indicates the AtSMU2 protein. D, Phenotypic analyses of various mutants. Homozygous mutant plants (smu2-1, smu2-2, smu1-2, and sta1-1) were identified among segregating populations and were subsequently self-pollinated two or three times. Phenotypic analysis was conducted as described in “Materials and Methods.” E, Dry sta1-1 (left), smu2-1 sta1-1 (middle), and smu2-1 (right) plants.

