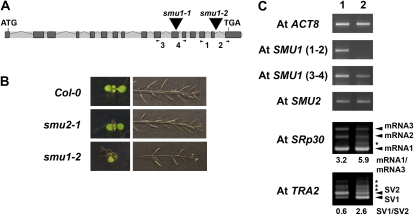
Figure 8.
Analysis of Atsmu1 mutant alleles. A, Structure of the AtSMU1 gene and the T-DNA insertions in the Atsmu1-1 and Atsmu1-2 mutants (triangles). B, Phenotypes of Col-0 wild-type, Atsmu2-1 (F4), and Atsmu1-2 (F3) plants. Seedlings of smu1-2 at 7 DAG often showed an abnormal number of cotyledons (left panels; see Table I) and arrangement of flowers/siliques in the primary inflorescence (right panels). C, RT-PCR comparison of AtSMU2, AtSMU1, AtSRp30, and AtTRA2 transcripts in Col-0 and smu1-2. Two pairs of primers were used to amplify different regions of the AtSMU1 cDNA prepared from 14-DAG seedlings of Col-0 (lane 1) and smu1-2 (lane 2) plants. Numbers in parentheses indicate the primers used for the RT-PCR; the positions of the primers are shown as arrowheads in A. Arrowheads indicate the positions of known SVs of SRp30 and TRA2, while asterisks correspond to the potentially novel SVs. Ratios of differentially accumulated SVs are shown below the panels. [See online article for color version of this figure.]

