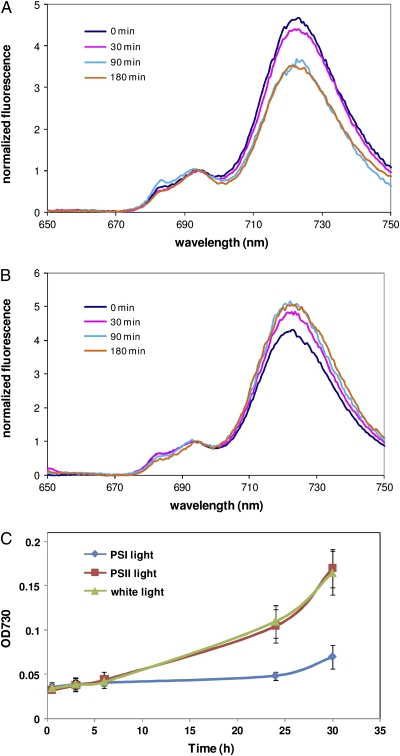
Figure 1.
Physiological responses of Synechocystis to PSI and PSII light. A and B, Chl fluorescence emission spectra of cells illuminated with PSI light (A) and PSII light (B) were measured following excitation of Chl at 435 nm. Curves were normalized to the fluorescence intensity at 695 nm. C, Cell growth was monitored by measuring absorption (OD [optical density]) at 730 nm under PSI light or PSII light. Error bars represent sd based on mean values of three independent growth experiments.

