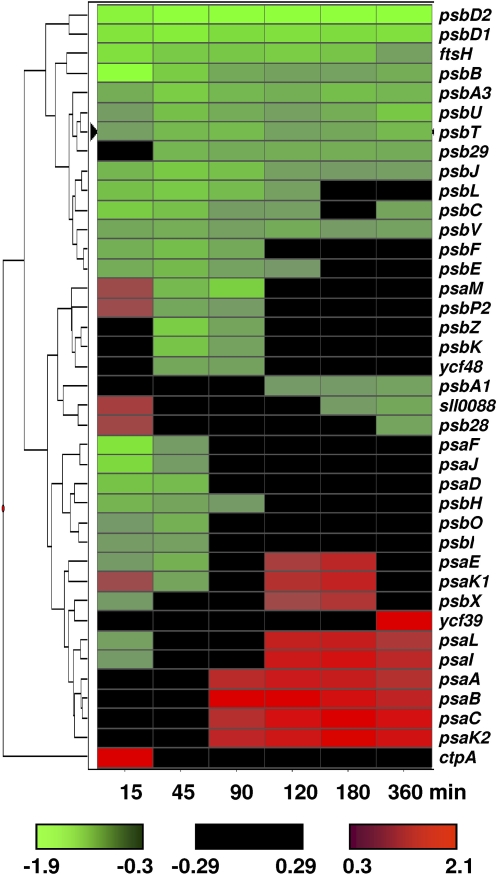
Figure 2.
A hierarchical cluster display of photosystem genes regulated by PSI and PSII light. Expression ratios [log2(PSII light/PSI light)] of all PSI and PSII genes were used to generate the cluster using Spotfire Decisionsite version 8.0. Euclidean distance was used as a measure of similarity between various time points, and genes were clustered using the weighted pair gene method with arithmetic means. The color scale used to define the regulation pattern of a gene is provided at the bottom. The fold changes of genes are provided in Supplemental Table S2.

