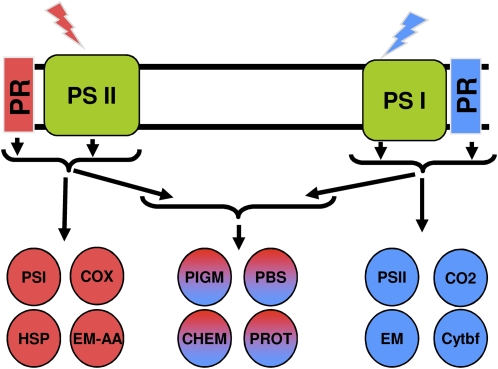
Figure 3.
A schematic representation of major cellular processes controlled by PSI and PSII light. Blue and orange circles represent responses associated with PSI light and PSII light, respectively. Circles containing both blue and orange represent cellular processes controlled by both PSI and PSII light. The list of regulated genes belonging to these processes is provided in Supplemental Table S2. CHEM, Chemotaxis; CO2, CO2 fixation; COX, cytochrome oxidase; Cytbf, cytochrome b6f complex; EM, energy metabolism; EM-AA, energy metabolism amino acids; PIGM, pigment biosynthesis; PR, photoreceptor(s); PROT, proteases.

