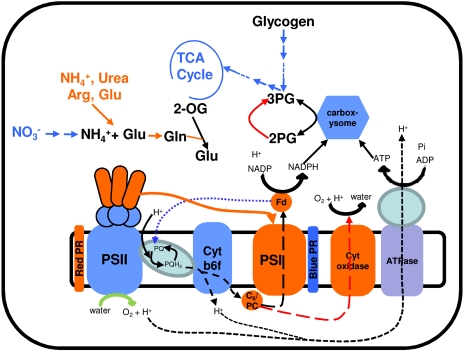
Figure 7.
A summary of key cellular adaptations during changes in light quality. Blue and orange colors represent responses associated with PSI light and PSII light, respectively. The photosynthetic linear electron transfer chain is represented by the dotted black line. The dotted blue line (from ferredoxin [Fd] to PQ) denotes the cyclic electron transfer chain under PSI light. The dotted red lines show the electron transfer to cytochrome c oxidase under PSII light. The solid orange line denotes the movement of rod complex to PSI under PSII light. 2-OG, 2-Oxoglutarate; 2PG, 2-phosphoglycolate; 3PG, 3-phosphoglycerate.

