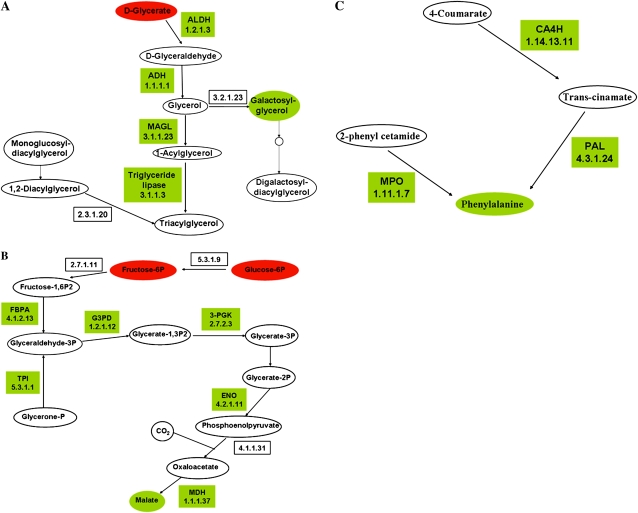
Figure 6.
Representation of selected metabolic pathways induced in –P-stressed nodules. Drawings are based on PathExpress outputs (Goffard and Weiller, 2007b; Goffard et al., 2009) and contain two types of nodes: metabolites represented by ellipses, and enzymes (boxes) labeled with the enzyme name or abbreviation and/or the EC number. Enzymes coded by genes included in the PhvGI are shown. The color code indicates the induced gene expression of enzymes (Fig. 3; Supplemental Table S1) or increased metabolite pools (Table II; green) or respective decrease (red). Other metabolites shown in each pathway (white ellipses) were not detected in our analysis. A, Glycerolipid metabolism. ADH, Alcohol dehydrogenase; ALDH, aldehyde dehydrogenase; MAGL, monoglyceride lipase. B, Glycolysis-gluconeogenesis-carbon fixation. ENO, Enolase 2; FBPA, Fru-bisphosphate aldolase; G3PD, glyceraldehyde-3-phosphate dehydrogenase; MDH, malate dehydrogenase; 3-PGK, phosphoglycerate kinase; TPI, triosephosphate isomerase. C, Phe metabolism. CA4H, trans-Cinnamate 4-monooxygenase; MPO, myeloperoxidase; PAL, Phe ammonia lyase.

