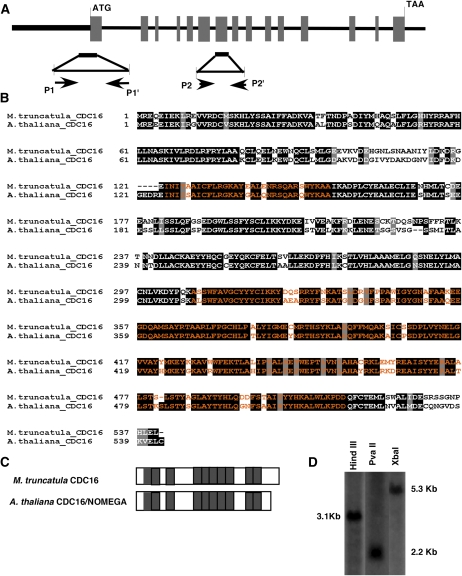
Figure 1.
Structural analysis of the M. truncatula CDC16 gene. A, Gene structure of the MtCDC16 gene. Translated regions of exons are shown as gray boxes. The boldface line before the translational start site represents the 5′-untranslated and the putative promoter regions. The 500-bp fragment indicated below, which includes portions of exon 1 and the 5′-untranslated region, marks the area that was used for constructing the RNAi vector. The location of the two primer sets (P1-P1' and P2-P2') used for RT-PCR analysis of MtCDC16 transcripts is indicated. B, Alignment of the predicted M. truncatula CDC16 protein with the Arabidopsis CDC16 protein. Blocks of amino acid sequences marked in orange indicate the TPR motifs. C, Graphical representation of the distribution of TPR motifs within M. truncatula CDC16 and Arabidopsis CDC16 proteins. Gray boxes indicate the TPR motifs. D, Southern-blot analysis to estimate the copy number of MtCDC16 in M. truncatula genome.

