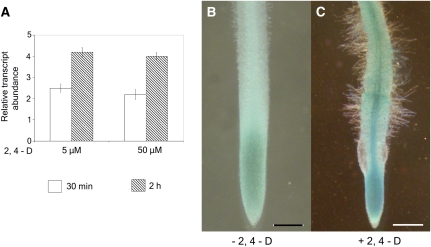
Figure 7.
Auxin response phenotype of MtCDC16. A, Quantitative RT-PCR analysis to estimate the transcript abundance of MtCDC16 in wild-type roots in the presence and absence of 2,4-D. Each point represents the mean of three replicates with error bars representing the sd. B and C, Histochemical GUS staining patterns of CDC16:GUS in transgenic hairy roots in the absence (B) and presence (C) of 0.5 μm 2,4-D. Bars = 50 μm.

