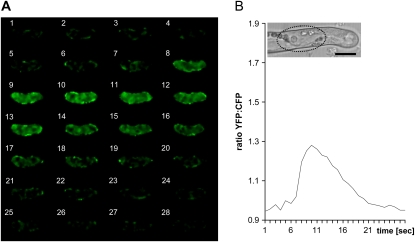
Figure 5.
Spatio-temporal YFP-to-CFP ratio changes during a single Ca2+ spike within the nucleus of a NF-treated M. truncatula root hair. A, Frame-by-frame imaging sequence (1 s intervals) reveals the distribution and intensity of the YFP-to-CFP ratio throughout a complete nuclear Ca2+ spike. Initial steep increases in ratio changes occur primarily at the inner periphery of the nucleus (frames 5–8), before reaching maximum levels (frames 9–11). Intranuclear Ca2+ then progressively drops to the original resting levels (frames 14–21). B, Graph showing the average YFP-to-CFP ratios of the Ca2+ spike shown in A, corresponding to the region of interest drawn over the nucleus (dotted line in inset) that is positioned close to the tip of the growing root hair. Timing in A and B is in seconds. Magnification is the same for all images. Bar in B = 15 μm.

