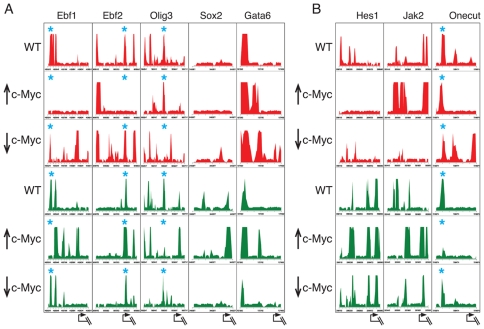
Figure 6. c-Myc levels influence the pattern of histone H3 lysine methylation in mES cells.
(A) a group of genes bound by c-Myc (B) a group of non-Myc target genes. c-Myc levels were manipulated by (1) Lentiviral-delivered overexpression (↑c-Myc) (2) knock-down (↓ c-Myc), or (3) empty lentiviral vector control in ES cells. ChIP DNA isolated with anti-H3K4me3 or anti-H3-K27me3 was applied to the custom-designed arrays (see text). Enrichment ratios (log2 scale) for ChIP-enriched versus total input genomic DNA were processed by ACME and the given p values (−log10; y axis) identifying significant sites were plotted (see Methods). Red peaks present H3-K27me3 and green peaks present H3K4me3. Tick marks on the y-axis are spaced 400 bp apart. Asterisks mark positions of overlapping (bivalent) H3-K4me3 and H3-K27me3 peaks. The arrows at bottom indicate transcriptional start sites.

