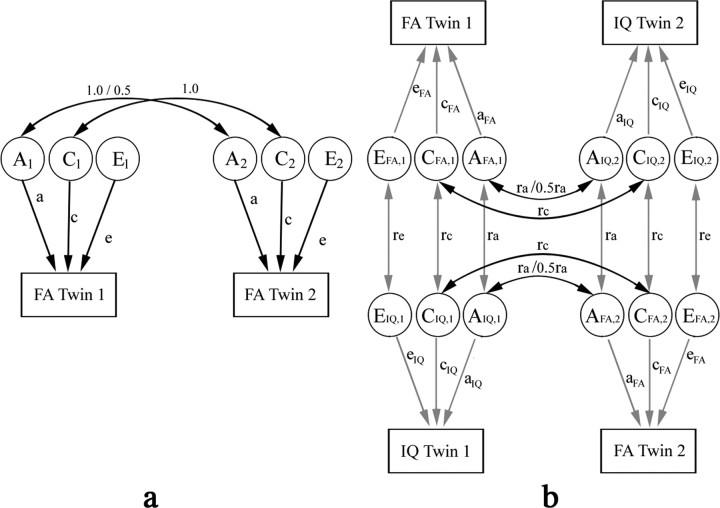
Figure 3.
Path diagrams for (a) univariate (for FA) and (b) bivariate cross-trait (for FA and IQ) structural equation models (a and b are adapted from Neale et al., (1992) and Miles et al., (2002) respectively. a, Each twin's phenotypic measure (e.g., FA in this study) is assumed to be determined by additive genetic (A) and environment factors. Environmental factors are further subdivided into those that the co-twins share (denoted by C, e.g., family rearing environment, and common developmental factors in utero), and those that are unique for each twin (denoted by E, e.g., they may be educated at different schools). Contributions of the ACE factors to the phenotype are indicated by single arrows and assumed to be the same between co-twins (twin 1 and twin 2) for simplification, with their weights, or path coefficients, denoted by a, c, and e, respectively. Random noise, or experimental measurement error, is included in component E, and assumed to be independent between twin 1 and 2 (no correlation). Correlations in the genetic and shared environmental factors between co-twins are indicated by double arrows. For A1 and A2, the correlation coefficient is equal to 1 for MZ and 0.5 for DZ twin pairs. The correlation coefficient between C1 and C2 is always 1 from the definition of the shared environment. b, In bivariate cross-trait SEM, we assume that there are common genetic and environmental factors that affect various phenotypes within an individual. Here, we only consider factors that affect two phenotypes, such as FA and IQ. The effects of these common factors are estimated by comparing the difference between MZ and DZ pairs, in the correlation between the two phenotypes within the same individual (cross-trait within-individual), and also in the correlation between one phenotype in one twin, and the other phenotype in the other twin (cross-trait cross-twin). The cross-trait within-individual correlation (the correlation between FA and IQ in twin 1 or in twin 2, shown as connected by gray arrows) is divided into additive genetic, and shared and unique environmental components (e.g., AFA, i, CFA, i, and EFA, i for FA, and AIQ, i, CIQ, i, and EIQ, i for IQ; i = 1 or 2 for twin 1 or 2), and the correlation coefficients between AFA, i and AIQ, i, CFA, i and CIQ, i, and EFA, i and EIQ, i, are denoted by ra, rc, and re, respectively. The cross-trait cross-twin correlation is shown as AFA, i and AIQ, j, and CFA, i and CIQ, j connected by black arrows, for FA in twin i and IQ in twin j, where i, j = 1 or 2, and i ≠ j. There is no re term for EFA, i and EIQ, j, because the unique environmental factors between subjects are not correlated. The covariance across the two phenotypes within the same subject, or separately in the two subjects, is then derived by multiplication of the path coefficients for the closed paths in the path diagram. For example, covariance between FA in twin 1 and IQ in twin 2 is equal to aFA·ra·aIQ+cFA·rc·cIQ for MZ twins, and aFA·1/2ra·aIQ+cFA·rc·cIQ for DZ twins. This implies that any excess in cross-trait cross-twin correlation in MZ twins over that in DZ twins is attributed to common genetic factors that affect both FA and IQ. Correlations for the same phenotype (FA or IQ) between co-twins, as have already been described in a, are not shown for simplification.

