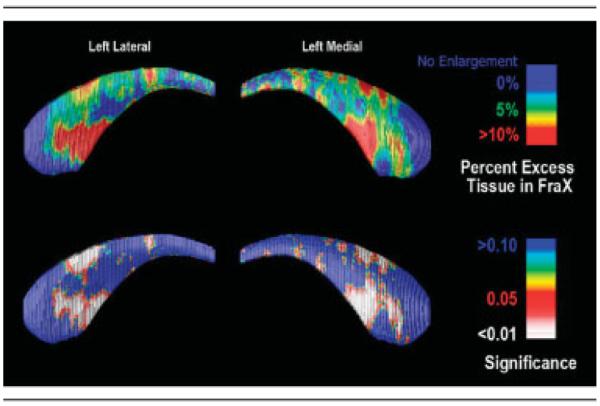
Fig 3.

Surface-based maps of the caudate nucleus (CN). (top row) Local percentage difference in CN size between fragile X syndrome (FraX) and control subjects (top row). The ventral CN head shows systematic enlargement in FraX subjects, with an average 10% radial expansion compared with control subjects. The significance of the group differences in radial extent is plotted (bottom row) detecting extensive enlargement of the CN head.
