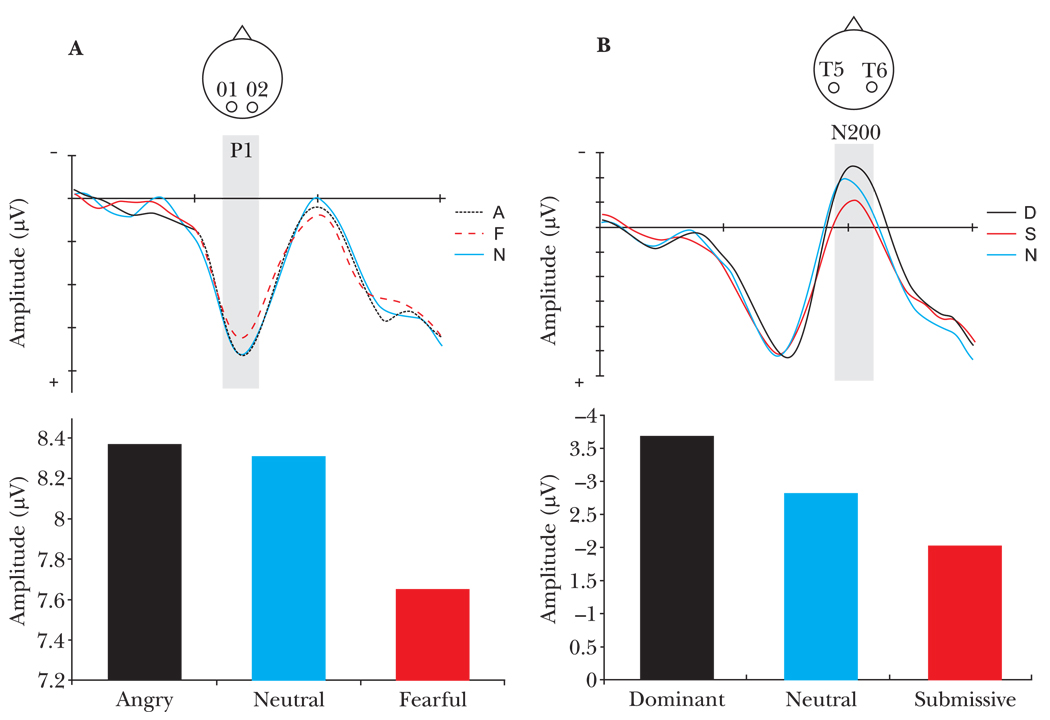
Figure 2.
ERP measures of face processing. (a) P1 response recorded from electrodes O1 and O2 showed modulation of peak amplitude, occurring between 129–135 ms, by type of facial expression of emotion F(4,52 = 2.56, p < .05). (b) N200 response recorded from electrodes T5 and T6 displayed modulation of peak amplitude, occurring between 160–240 ms, by type of facial posture F(4,52 = 3.06, p < .05).

