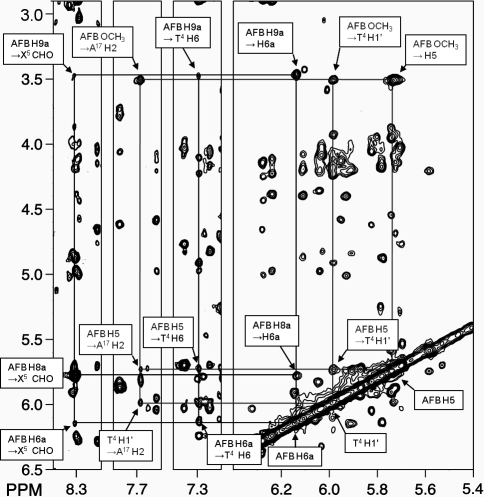
Figure 4.
A tile plot of an 800 MHz NOESY spectrum obtained at 250 ms mixing time, showing the assignments of AFB-α-FAPY protons and NOEs to neighboring nucleotide protons. The black lines indicate the assignmnents of the AFB-α-FAPY protons and the gray lines indicate NOEs between the AFB moiety and DNA.

