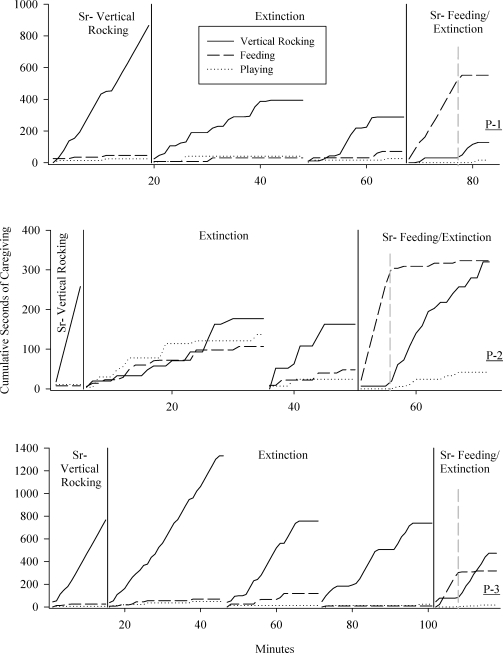
Fig 1.
The cumulative duration of caregiving in seconds (y-axis) during Experiment 1 for Participants 1, 2, and 3. Data are depicted in 1-min bins along the x-axis, and breaks in the data paths indicate the start of a new session. Vertical dashed lines indicate the transition from reinforcement of a response to extinction during the resurgence test. Each panel represents data from an individual participant.

