
Fig. 4.
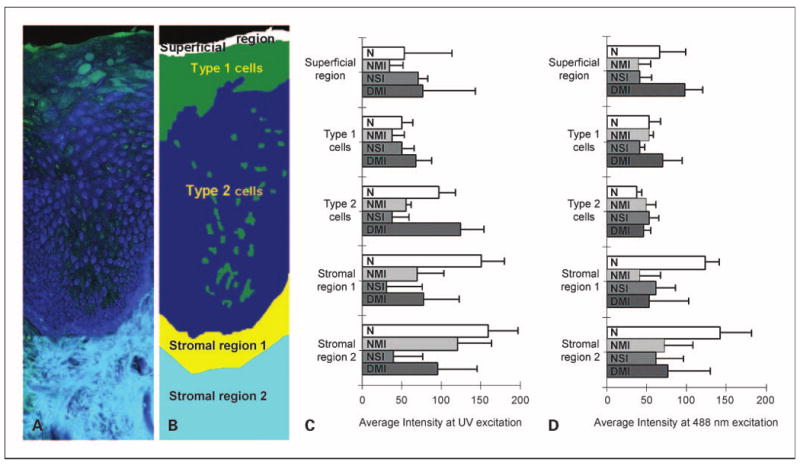
Quantitative analysis of average fluorescent intensities of normal, inflammatory, and dysplastic tongue tissue. Overlaid UV and 488 nm excited fluorescence images (A) and a simplified cartoon of normal tongue (B) showing the approximate distribution of the epithelial and stromal regions. Type 1 cells represent cells with weak cytoplasmic fluorescence at UV excitation. Type 2 cells represent cells with strong cytoplasmic fluorescence at UV excitation. Stromal region 1 includes stroma that is 100 to 200 μm below the basement membrane, whereas stromal region 2 represents deeper stroma. Average fluorescence intensities at UVexcitation (C) and 488 nm excitation (D) for each epithelial and stromal subregion. Bars, 1 SD. N, normal without inflammation (n = 8); NMI, normal with mild to moderate inflammation (n = 2); NSI, normal with severe inflammation (n = 3); DMI, dysplasia with mild to moderate inflammation (n = 6).